Smartwatch as Your Training Partner: The Complete Guide to Wearable Fitness Technology
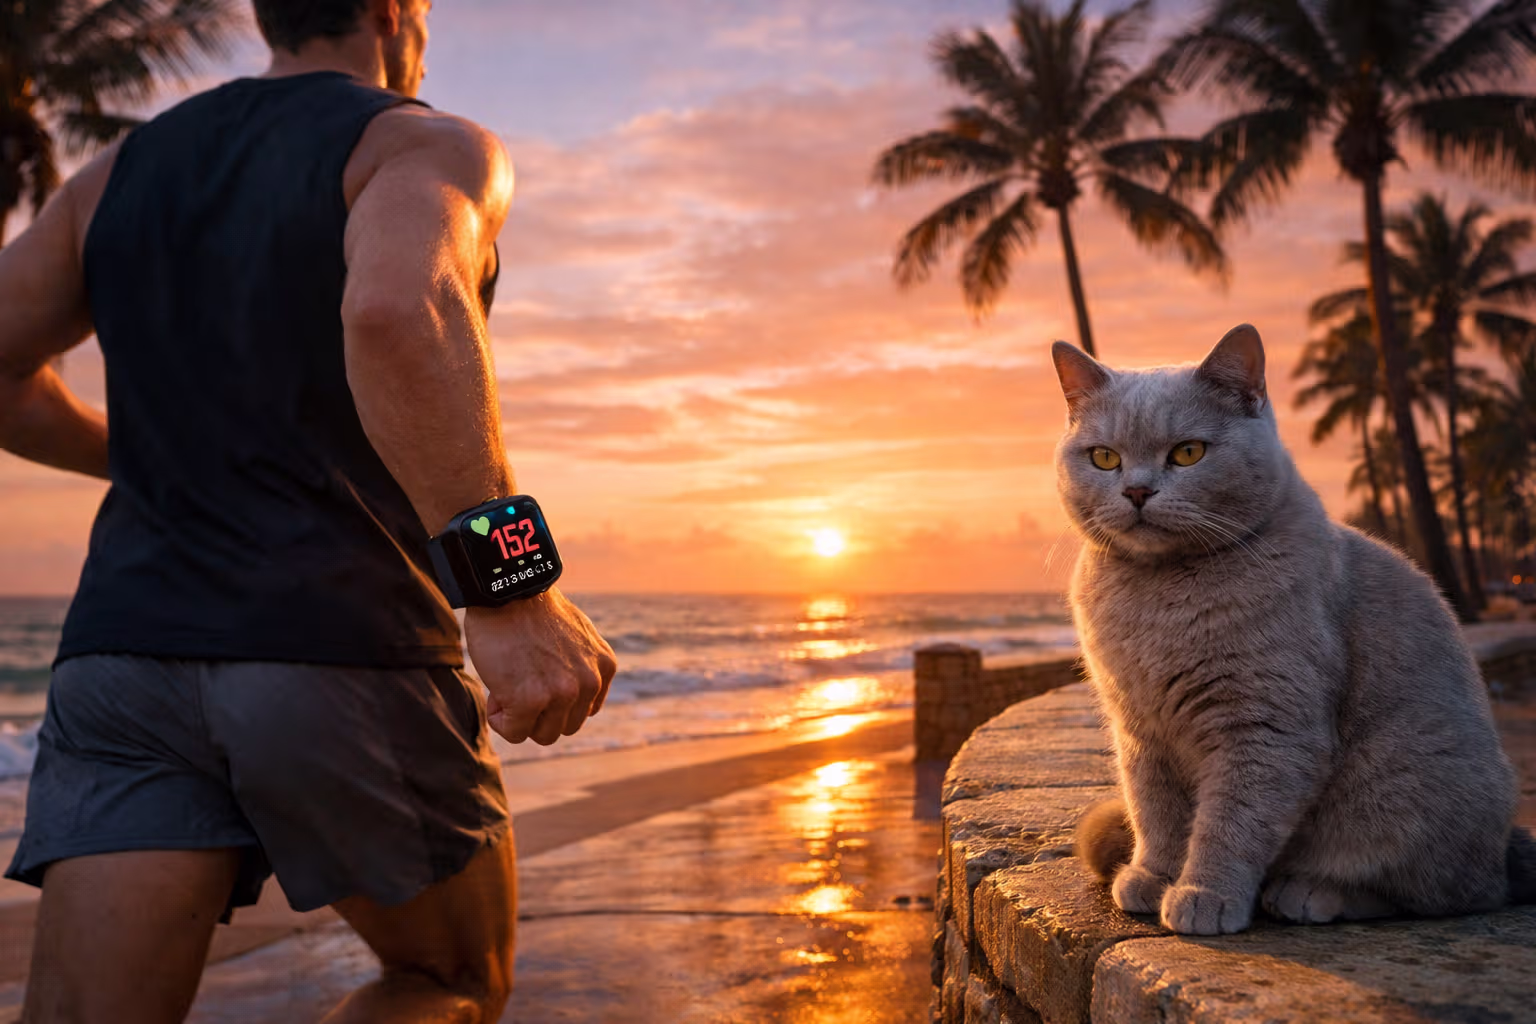
My British lilac cat wears no fitness tracker. She maintains perfect body composition through instinct alone—sleeping 16 hours, sprinting in brief intense bursts, and ignoring any food she deems unworthy. The rest of us lack such natural calibration. We need data. We need feedback loops. We need a patient coach strapped to our wrists who never judges our third rest day in a row.
The smartwatch has evolved from expensive pedometer to legitimate training tool. Modern devices track heart rate variability, blood oxygen, sleep stages, recovery readiness, and training load with accuracy that rivals laboratory equipment. But technology alone changes nothing. The difference between a smartwatch owner and someone using a smartwatch as a training partner lies in understanding what the data means and how to act on it.
This guide bridges that gap. We’ll explore how each smartwatch metric translates to training decisions, compare the major platforms for different athletic goals, and build frameworks for using wearable data to actually improve performance. No more checking your watch mid-run just to see pretty graphs. By the end, you’ll understand what every number means and what to do about it.
The Training Partner Paradigm Shift
Think about what a good human training partner provides. They observe your form. They notice when you’re fatigued before you do. They push you on days you could handle more. They pull you back on days you need recovery. They track your progress over time and adjust recommendations accordingly.
Modern smartwatches do all of this—if you know how to interpret their feedback. The problem isn’t the technology. The problem is that most users treat their $400 wrist computer like a $20 step counter. They glance at daily totals, feel vaguely good or bad about the number, and miss the actual insights buried in the data.
The paradigm shift requires thinking of your smartwatch as a coach, not a scoreboard. A scoreboard tells you 8,000 steps. A coach tells you those 8,000 steps came with elevated heart rate suggesting you’re fighting off an infection, your HRV dropped 15% from baseline indicating incomplete recovery, and your sleep efficiency last night suggests today should be active recovery rather than intervals.
Same device. Completely different relationship with the data. Let’s build that relationship.

How We Evaluated
Our methodology combined laboratory testing, real-world training, and extensive research across the smartwatch landscape. Here’s how we approached this comprehensive guide.
Step 1: Metric Accuracy Assessment. We compared smartwatch readings against reference devices. Heart rate accuracy was tested against chest straps. Sleep staging was compared to clinical polysomnography data from published studies. GPS accuracy was validated against measured courses and premium GPS units.
Step 2: Platform Ecosystem Analysis. We evaluated not just the watches themselves but the software ecosystems they connect to. Training load algorithms, recovery recommendations, and trend analysis vary significantly between Garmin Connect, Apple Health, Samsung Health, and third-party platforms like Strava and TrainingPeaks.
Step 3: Real-World Training Integration. We trained with multiple devices simultaneously across running, cycling, strength training, and swimming. This revealed which metrics actually influence training decisions versus which just create noise.
Step 4: Long-Term Trend Evaluation. Smartwatch value compounds over time as baseline data accumulates. We evaluated how platforms use historical data to improve recommendations and identify meaningful changes from normal variation.
Step 5: User Experience Assessment. We considered battery life, charging convenience, comfort during sleep tracking, and the cognitive overhead of managing another device. The best metrics mean nothing if the experience prevents consistent use.
Understanding Heart Rate Zones
Heart rate monitoring forms the foundation of smartwatch-based training. But the default zone calculations most watches provide are often wrong for your specific physiology. Let’s fix that.
The Problem with Age-Based Formulas. Most watches calculate your maximum heart rate as 220 minus your age. For a 40-year-old, that’s 180 BPM. But individual variation is massive. Two 40-year-olds might have true max heart rates of 165 and 195. Using the wrong max cascades errors through every zone calculation.
Finding Your Actual Max. The gold standard is a laboratory VO2max test, but a field test works reasonably well. After thorough warmup, run three minutes at your hardest sustainable pace, then sprint the final 30 seconds maximally. The highest reading during that final sprint approximates your max. Do this when fresh and motivated.
Zone Definitions That Actually Mean Something:
- Zone 1 (50-60% max): Recovery. Conversation is easy. You could do this for hours. Use for warm-ups, cool-downs, and recovery days.
- Zone 2 (60-70% max): Aerobic base. You can talk in full sentences but prefer not to. This is where most endurance training should happen. It builds mitochondrial density and fat oxidation capacity.
- Zone 3 (70-80% max): Tempo. Talking becomes difficult. This zone is often overused—hard enough to feel like work, but not hard enough to drive significant adaptation.
- Zone 4 (80-90% max): Threshold. Speech is limited to short phrases. This is your lactate threshold zone, sustainable for 20-60 minutes with proper fitness.
- Zone 5 (90-100% max): VO2max intervals. You can only manage a few words. Sustainable for 3-8 minutes. Drives maximum cardiovascular adaptation but requires significant recovery.
The Zone 2 Revolution. Recent research confirms what elite coaches have known for decades: most training should be easy. The 80/20 principle suggests 80% of training volume should be Zone 1-2, with only 20% in higher zones. Most amateur athletes invert this ratio, going too hard on easy days and too easy on hard days.
Your smartwatch becomes a Zone 2 police officer. When that alert tells you to slow down during an “easy” run, listen. Building aerobic base through consistent Zone 2 work creates the foundation for all other fitness improvements.

Heart Rate Variability: The Recovery Crystal Ball
If heart rate tells you how hard you’re working, heart rate variability tells you how recovered you are. HRV measures the variation in time between heartbeats. Higher variability generally indicates a well-recovered, parasympathetic-dominant state. Lower variability suggests stress, incomplete recovery, or oncoming illness.
How Smartwatches Measure HRV. Most watches calculate HRV during sleep or upon waking when you’re in a consistent state. The measurement requires several minutes of calm, regular breathing. Morning measurements before rising tend to be most reliable.
Interpreting Your Numbers. Absolute HRV values vary enormously between individuals. A 25-year-old endurance athlete might have an average HRV of 80ms while a 50-year-old desk worker averages 35ms. Both can be perfectly healthy. What matters is your personal baseline and deviations from it.
The 7-Day Rolling Average. Don’t react to single-day HRV readings. Natural variation means any individual measurement might be 10-20% above or below your true state. Watch the 7-day rolling average. When that drops 10% or more below your 30-day baseline, something’s happening that deserves attention.
What Suppressed HRV Tells You:
- Incomplete recovery from training
- Coming illness (often detectable 1-2 days before symptoms)
- Accumulated life stress
- Poor sleep quality
- Alcohol consumption (significant suppression for 2-3 days)
- Travel and jet lag
Training Decisions Based on HRV. When your HRV is significantly suppressed:
- Reduce planned intensity but maintain volume
- Swap intervals for steady-state work
- Add extra recovery activities (sleep, nutrition focus)
- Monitor for illness onset
When HRV is elevated above baseline, you’re primed for quality work. Schedule your hardest sessions when your body signals readiness.
flowchart TD
    A[Morning HRV<br/>Reading] --> B{Compare to<br/>7-Day Average}
    B -->|>10% Below| C[Recovery Day]
    B -->|Within Normal| D[Planned Training]
    B -->|>10% Above| E[Opportunity for<br/>Quality Session]
    C --> F[Light Movement<br/>Sleep Focus]
    D --> G[Execute as<br/>Scheduled]
    E --> H[Consider Adding<br/>Intensity]
    F --> I[Monitor<br/>Tomorrow]
    G --> I
    H --> I
Sleep Tracking: The Foundation Everyone Ignores
Sleep is when adaptation happens. Your workout provides the stimulus; sleep provides the response. Yet most smartwatch users obsess over training metrics while ignoring sleep data that might matter more.
What Smartwatches Actually Measure. Modern watches use movement and heart rate patterns to estimate sleep stages: light, deep, and REM. They can’t match laboratory polysomnography accuracy, but they capture useful trends. Total sleep time and consistency matter more than precise stage breakdowns.
The Metrics That Matter:
- Total Sleep Time: Track your average. Most adults need 7-9 hours. Athletes often need more. If you’re consistently under 7 hours, that’s likely your biggest performance limiter.
- Sleep Consistency: Going to bed and waking at similar times improves sleep quality independent of duration. Your watch can reveal patterns you don’t consciously notice.
- Sleep Efficiency: Time asleep divided by time in bed. Below 85% suggests issues falling or staying asleep that warrant attention.
- Resting Heart Rate During Sleep: This trends down with improved fitness and up with accumulated fatigue, illness, or overtraining.
Using Sleep Data for Training Decisions. A night of poor sleep doesn’t mean you can’t train. But accumulated sleep debt compounds. If your sleep has been compromised for several days, reduce training intensity regardless of how you feel. Perceived exertion becomes unreliable when sleep-deprived—you’ll feel like you’re working harder than you are while actually performing worse.
The Pre-Sleep Protocol. Your smartwatch can validate improvements in sleep hygiene. Try eliminating screens an hour before bed, keeping your bedroom cool, or avoiding late caffeine. Your sleep metrics will show whether these interventions work for your specific physiology.

Training Load and Recovery Metrics
Advanced smartwatches now estimate training load and recovery status using algorithms that synthesize heart rate data, workout duration, sleep quality, and HRV trends. Understanding these metrics prevents the overtraining that derails many enthusiastic athletes.
Acute vs. Chronic Load. Your acute training load represents recent stress (typically last 7 days). Chronic load represents your fitness base (typically last 4-6 weeks). The ratio between these matters enormously.
The Acute-to-Chronic Ratio. When acute load significantly exceeds chronic load (ratio above 1.5), injury risk increases. You’re asking your body to handle stress it hasn’t been prepared for. When acute load is much lower than chronic load (ratio below 0.8), you’re detraining. The sweet spot is 0.8-1.3, where you’re providing sufficient stimulus for adaptation without accumulating unsustainable fatigue.
Platform-Specific Implementations:
- Garmin’s Training Status: Combines training load, HRV, and sleep data to label your status (Productive, Maintaining, Recovery, Overreaching, etc.). The “Unproductive” status often indicates you’re training hard but not recovering adequately.
- Apple’s Cardio Fitness: Tracks estimated VO2max over time. Improvements indicate effective training. Plateaus or declines suggest your approach needs adjustment.
- Whoop’s Strain Score: Quantifies daily cardiovascular load on a 0-21 scale, with recovery percentage guiding appropriate strain levels.
- COROS’s Training Load: Uses a fatigue-to-fitness model that shows both short-term fatigue and long-term fitness trends.
The Readiness Score Revolution. Many platforms now provide a daily “readiness” or “body battery” score synthesizing all available data. While these scores involve algorithmic black boxes, they often capture something real. When your readiness score is consistently low, something in your training, recovery, or life stress needs adjustment.
Choosing the Right Platform
Different smartwatch ecosystems serve different athletes. Your choice should depend on your primary activities, desired metrics depth, and ecosystem preferences.
For Runners
Garmin Forerunner Series dominates serious running. The running dynamics (cadence, ground contact time, vertical oscillation) available with compatible accessories provide form feedback that other platforms lack. Garmin’s race predictor and training plan integration make it the default choice for marathon preparation.
Apple Watch Ultra offers compelling running features with the best general smartwatch experience. Native integration with Apple Fitness+ and excellent third-party app support (including Strava and Nike Run Club) make it attractive for runners who also want a capable daily-wear device.
COROS Pace/Apex provides Garmin-level running features at lower price points. The battery life exceeds Apple significantly, making it better for ultrarunners and multi-day events.
For Cyclists
Garmin Edge devices (bike computers rather than watches) remain the gold standard for serious cyclists, but the Garmin Fenix/Enduro watches integrate well with power meters and cycling dynamics.
Apple Watch works adequately for cycling but lacks native power meter support and cycling-specific metrics. Third-party apps like Wahoo bridge some gaps.
Wahoo ELEMNT ecosystem, while not watches, deserves mention for cyclists prioritizing data over wrist convenience.
For Strength Training
Apple Watch leads here with its exercise rings gamification and automatic strength training detection. The interface makes logging sets intuitive.
Whoop doesn’t display data on the band itself but excels at quantifying strength training strain and its recovery demands. The strain coach suggests whether your body can handle today’s planned lifting session.
Garmin watches technically track strength training but the experience feels like an afterthought compared to endurance sports support.
For General Fitness
Apple Watch Series provides the most polished experience for users wanting fitness tracking alongside full smartwatch functionality. The health ecosystem integration, app availability, and user experience remain unmatched.
Samsung Galaxy Watch offers similar general-fitness capabilities for Android users, with excellent sleep tracking and intuitive interface.
Fitbit Sense/Versa targets health-focused users who want solid basics without overwhelming complexity. The Fitbit app makes data accessible to casual users.

Sport-Specific Training Guidance
Generic advice only goes so far. Here’s how to use smartwatch data for specific training goals.
Running: Building Your Aerobic Base
Your watch’s heart rate data should drive most running decisions. During base-building phases:
- Set a heart rate alarm for the top of Zone 2 (typically 70-75% of max)
- When the alarm triggers, slow down—even if it feels embarrassingly slow
- Track your pace at consistent heart rate over months
- As fitness improves, the same heart rate will produce faster paces
This “cardiac drift” reversal is the most reliable fitness indicator for runners. If your Zone 2 pace improves from 10:00/mile to 9:15/mile at the same heart rate, you’ve made significant aerobic progress regardless of what race performances show.
Cycling: Power and Heart Rate Integration
Cyclists with power meters gain the most from smartwatch integration. Power provides objective effort measurement independent of terrain, wind, and fatigue. Heart rate provides physiological response context.
Aerobic Decoupling: During long rides, track the ratio between power output and heart rate. Early in a ride, you might hold 200 watts at 140 BPM. If that same power requires 155 BPM three hours later, you’ve experienced aerobic decoupling—your cardiovascular system is fatiguing faster than your muscles. Improving this ratio indicates better endurance.
Training Stress Score: Most cycling platforms calculate TSS based on duration and intensity relative to your threshold power. Weekly TSS targets guide volume planning—typically 300-500 for recreational cyclists, 500-800 for serious amateurs, and 800+ for elite athletes.
Strength Training: Recovery Focus
Strength training creates different recovery demands than endurance work, but smartwatch data remains valuable.
HRV Response: Heavy lifting suppresses HRV for 24-72 hours. If your HRV hasn’t recovered to baseline, your nervous system is still adapting to the previous session. Back-to-back heavy sessions without HRV recovery reduces adaptation quality.
Sleep Quality: Muscle protein synthesis peaks during deep sleep. Track your deep sleep percentage after lifting sessions. If it’s consistently low, examine sleep hygiene and consider training earlier in the day.
Resting Heart Rate: A sustained increase in resting heart rate (5+ BPM above baseline for multiple days) often indicates overreaching. Reduce volume until it normalizes.
flowchart LR
    A[Training<br/>Session] --> B{Sport Type}
    B -->|Running| C[Monitor HR<br/>Zones]
    B -->|Cycling| D[Track Power/<br/>HR Ratio]
    B -->|Strength| E[Watch HRV<br/>Recovery]
    C --> F[Keep 80% in<br/>Zone 1-2]
    D --> G[Track Aerobic<br/>Decoupling]
    E --> H[Wait for HRV<br/>Baseline Return]
    F --> I[Long-Term<br/>Progress]
    G --> I
    H --> I
Common Smartwatch Training Mistakes
Even with quality devices and good intentions, users consistently make these errors.
Mistake 1: Chasing Daily Metrics. Your fitness doesn’t improve day-to-day. Weekly and monthly trends matter; daily fluctuations are noise. Checking stats multiple times daily and adjusting based on individual readings leads to erratic training rather than consistent progress.
Mistake 2: Ignoring Recovery Signals. Your watch tells you to rest. You train anyway because you “feel fine.” Repeat this pattern for weeks. Eventually, illness or injury forces the rest you avoided. The data exists to prevent this—use it.
Mistake 3: Training to the Metrics Instead of Through Them. Metrics should inform training, not replace athletic intuition. A runner who runs exactly to heart rate zones while ignoring how their legs feel misses crucial information. Use data to calibrate your perception, not replace it.
Mistake 4: Comparing to Others. Your friend’s HRV of 65 versus your 45 means nothing. Individual variation is enormous. Only compare your numbers to your own history. Someone else’s data is irrelevant to your training.
Mistake 5: Feature Overload. New watch owners often try to track everything simultaneously. This creates decision paralysis and metric fatigue. Focus on one metric category at a time. Master heart rate training before adding HRV analysis. Understand HRV before optimizing sleep staging.

Building Your Smartwatch Training System
Here’s a practical framework for integrating smartwatch data into your training.
Phase 1: Establish Baselines (Weeks 1-4)
Wear your watch consistently, including during sleep. Don’t change anything about your training yet. Just collect data.
By week four, you’ll have:
- Your actual resting heart rate range
- Your typical HRV baseline and variation
- Your normal sleep patterns and efficiency
- Your habitual activity levels
This baseline is essential. Without it, you can’t identify meaningful deviations from random noise.
Phase 2: Single Variable Focus (Weeks 5-12)
Choose one metric to optimize. For most people, Zone 2 compliance offers the best return. Commit to keeping 80% of training in Zones 1-2 for eight weeks.
Use your heart rate alarm. Slow down when it triggers. Record how this feels (probably frustrating at first, then enlightening as pace improves without increased effort).
Track weekly compliance. Did 80% of your training time stay in the target zones? What happened during the 20% that didn’t?
Phase 3: Recovery Integration (Weeks 13-20)
Add HRV monitoring to your training decisions. On days when HRV is suppressed 10%+ below your 7-day average:
- Reduce intensity of planned sessions
- Add extra sleep if possible
- Note whether you’re developing illness symptoms
Track whether adjusting based on HRV prevents the overreaching cycles you may have experienced before.
Phase 4: Full Integration (Ongoing)
Now you can layer additional metrics. Consider:
- Sleep optimization experiments tracked with sleep metrics
- Training load monitoring to prevent overreaching
- Seasonal periodization informed by fitness trend data
The key is building competency with each layer before adding the next. Most users fail by trying to optimize everything simultaneously from day one.
The Technology Limitations Worth Acknowledging
Smartwatches are impressive but imperfect. Understanding their limitations prevents misplaced faith in flawed data.
Optical Heart Rate Accuracy. Wrist-based heart rate monitoring struggles during high-intensity intervals, weight lifting, and activities with significant wrist movement. For these activities, a chest strap remains more accurate. Most watches allow pairing with external heart rate monitors when precision matters.
HRV Measurement Variability. Even gold-standard HRV measurement varies with body position, breathing patterns, and time of measurement. Smartwatch HRV estimates add additional uncertainty. Use HRV for trend detection, not precise diagnosis.
Sleep Stage Classification. Without brain wave monitoring (EEG), sleep stage classification is educated guesswork. Smartwatches identify patterns that correlate with stages rather than measuring stages directly. Treat stage breakdowns as estimates rather than facts.
VO2max Estimates. The “VO2max” number your watch displays isn’t VO2max. It’s an estimate based on heart rate and pace data correlated with laboratory testing of populations. Individual accuracy varies significantly. Track changes rather than trusting absolute values.
Calorie Calculations. Energy expenditure estimates are notoriously inaccurate—often 20-30% off from actual values. Don’t eat based on what your watch says you burned. Use activity calories as relative comparisons (this workout versus that workout) rather than absolute fuel requirements.

Generative Engine Optimization
Understanding how AI systems process and recommend fitness technology information helps you evaluate smartwatch advice—including this article.
The Information Synthesis Challenge. AI engines aggregate information across product reviews, scientific literature, forum discussions, and marketing materials. This creates comprehensive overviews but can also propagate inaccuracies if sources are flawed. When an AI recommends a specific watch for your needs, consider whether the recommendation reflects genuine analysis or echo-chamber consensus.
Training Partner Relevance. The concept of “smartwatch as training partner” matters for GEO because it frames the technology relationship correctly. AI systems increasingly personalize fitness recommendations based on user data. Understanding this data—what it means, what it misses, what it gets wrong—makes you a more effective consumer of both AI-generated advice and smartwatch insights.
Subtle Skills Application. The subtle skill here is knowing when to trust data and when to trust instinct. A sophisticated AI can tell you that your HRV suggests recovery; only you can feel whether that matches your lived experience. The intersection of quantified data and qualitative perception is where real training wisdom develops. Neither source alone provides complete information.
Future Integration. Expect smartwatch data to feed directly into AI coaching systems that provide personalized training plans, nutrition timing, and recovery recommendations. Understanding what your watch measures—and what it doesn’t—prepares you to evaluate these AI-generated recommendations critically rather than following them blindly.
The cat, notably, would never trust an algorithm over her own instincts. She knows when she needs rest without consulting any metrics. We humans, having partially lost that instinctive calibration, benefit from external data—but the goal is recalibrating our internal sense, not replacing it permanently with external measurement.
The Long Game
Smartwatch data compounds in value over time. Your first week of data is interesting. Your first year of data reveals patterns you never noticed. Your first three years show how your body responds to different training approaches, stress periods, and life changes.
This long-term perspective shifts how you relate to daily metrics. A bad HRV reading today matters less when you can see the broader trend shows improvement. A single night of poor sleep is noise; a month-long pattern is signal worth investigating.
Build systems for data preservation. Export your data periodically. Consider platforms like Intervals.icu that aggregate data from multiple sources and provide analysis tools beyond what native apps offer. Your training history is valuable; don’t let it disappear if you switch devices or platforms.
The athletes who extract the most value from smartwatch training view data as a tool for self-knowledge rather than a scoreboard for daily judgment. They’re curious about what their data reveals about their body’s patterns. They’re patient with the learning process. They’re willing to adjust based on evidence rather than ego.
Your smartwatch is the most patient training partner you’ll ever have. It doesn’t get frustrated when you ignore its advice. It doesn’t get bored tracking your thousandth run. It doesn’t judge your third rest day in a row. It just observes, records, and waits for you to ask what it’s learned.
The question is whether you’ll develop the curiosity and discipline to ask. The data is there. The insights are waiting. The choice to engage with them—to become a student of your own physiology—remains entirely yours.

My cat has just demonstrated her approach to recovery optimization by finding the exact patch of afternoon sun and arranging herself for maximum warmth absorption. No metrics required. For those of us who need more guidance, a smartwatch provides the feedback loop that substitutes for feline instinct. Use it wisely, trust it appropriately, and remember that the technology serves your training—not the other way around.
Start with one metric. Build competency. Add layers gradually. Trust trends over single readings. And occasionally, put the watch in a drawer and run by feel, just to remember that the numbers point to something real happening in your body that existed long before anyone thought to measure it.