
Metal 4 Ultra: Dissecting a Sub-Millisecond Mandelbrot Benchmark on Apple Silicon
My British lilac cat, Kevin, has a peculiar habit. She stares at my monitor whenever fractals appear, pupils dilating at infinite complexity. Perhaps she understands something about recursive beauty that escapes most humans. Or she’s plotting world domination. Either way, she inspired this deep dive into why Apple Silicon tears through Mandelbrot computations like a hot knife through computational butter.
We’re examining a benchmark that pushes 1.12 million pixels through a GPU in under half a millisecond. That’s not a typo. The code achieves throughput exceeding 2 Gigapixels per second on M4 Max hardware. Understanding why requires dissecting both the software optimizations and the silicon architecture enabling them.
This isn’t your typical “hello world” GPU tutorial. We’re going surgical on a production-grade benchmark, exposing every trick that separates amateur shader code from something that makes hardware engineers nod approvingly.
The Benchmark Architecture at 10,000 Feet
Before diving into implementation details, let’s establish what this code actually does. The Mandelbrot set computation is embarrassingly parallel—each pixel’s value depends only on its coordinates and the iteration limit. This makes it an ideal GPU benchmark because it eliminates memory bandwidth bottlenecks and exposes raw computational throughput.
The benchmark structure follows a three-phase pattern: shader compilation, warmup execution, and statistical measurement. Each phase serves a specific purpose in producing reliable, reproducible performance numbers.
flowchart TD
    subgraph INIT["Initialization Phase"]
        A[MTLCreateSystemDefaultDevice] --> B[Create Command Queue]
        B --> C[Compile Shader with Fast Math]
        C --> D[Create Compute Pipeline]
        D --> E[Allocate Texture & Buffers]
    end

    subgraph WARMUP["Warmup Phase"]
        F[100 Warmup Iterations] --> G[GPU Cache Priming]
        G --> H[Driver Optimization Settling]
    end

    subgraph BENCH["Benchmark Phase"]
        I[10,000 Timed Iterations] --> J[GPU Timestamp Collection]
        J --> K[Statistical Analysis]
        K --> L[Percentile Calculation]
    end

    INIT --> WARMUP --> BENCH

    style INIT fill:#2d4a3e,stroke:#4a7c59
    style WARMUP fill:#4a3e2d,stroke:#7c6b4a
    style BENCH fill:#3e2d4a,stroke:#6b4a7c
The warmup phase deserves special attention. GPUs don’t operate at peak efficiency from a cold start. Caches need filling, driver heuristics need calibration, and power states need ramping. Those 100 warmup iterations ensure the subsequent 10,000 measured runs reflect steady-state performance.

Apple Silicon M4 Max: The Hardware Foundation
Understanding performance requires understanding the silicon. M4 Max represents Apple’s most capable GPU architecture to date, featuring a fundamentally different design philosophy than discrete GPUs from NVIDIA or AMD.
graph TB
    subgraph M4MAX["M4 Max SoC Architecture"]
        subgraph CPU["CPU Cluster"]
            P1[P-Core 1] & P2[P-Core 2] & P3[P-Core 3] & P4[P-Core 4]
            P5[P-Core 5] & P6[P-Core 6] & P7[P-Core 7] & P8[P-Core 8]
            P9[P-Core 9] & P10[P-Core 10] & P11[P-Core 11] & P12[P-Core 12]
            E1[E-Core 1] & E2[E-Core 2] & E3[E-Core 3] & E4[E-Core 4]
        end

        subgraph GPU["GPU - 40 Cores"]
            direction LR
            SC1["Shader Core\nCluster 1\n10 Cores"]
            SC2["Shader Core\nCluster 2\n10 Cores"]
            SC3["Shader Core\nCluster 3\n10 Cores"]
            SC4["Shader Core\nCluster 4\n10 Cores"]
        end

        subgraph MEM["Unified Memory Architecture"]
            UMA["128GB/s per Core\n512-bit Bus\nLPDDR5X"]
        end

        subgraph CACHE["Cache Hierarchy"]
            L2["48MB System Level Cache"]
        end
    end

    CPU <--> L2
    GPU <--> L2
    L2 <--> UMA

    style M4MAX fill:#1a1a2e,stroke:#4a4a6a
    style CPU fill:#2d3a4a,stroke:#5a7a9a
    style GPU fill:#4a2d3a,stroke:#9a5a7a
    style MEM fill:#3a4a2d,stroke:#7a9a5a
    style CACHE fill:#4a3a2d,stroke:#9a7a5a
The Unified Memory Architecture (UMA) eliminates the traditional CPU-GPU memory copy bottleneck. When our Swift code allocates a buffer with .storageModeShared, both CPU and GPU access the same physical memory. No PCIe transfers. No staging buffers. The data simply exists where both processors can reach it.
Each GPU core in M4 Max contains execution units optimized for different workloads. The Mandelbrot computation benefits specifically from the floating-point ALUs and the dedicated FMA (fused multiply-add) units that execute our core iteration loop.
Shader Code Dissection: The Metal Kernel
The heart of this benchmark lives in approximately 40 lines of Metal Shading Language. Let’s examine each optimization technique embedded in this deceptively simple code.
The Function Signature and Early Bounds Check
kernel void mandelbrot(
    texture2d<ushort, access::write> out [[texture(0)]],
    constant int &width [[buffer(0)]],
    constant int &height [[buffer(1)]],
    constant int &maxIter [[buffer(2)]],
    constant float &xMin [[buffer(3)]],
    constant float &dx [[buffer(4)]],
    constant float &yMin [[buffer(5)]],
    constant float &dy [[buffer(6)]],
    uint2 gid [[thread_position_in_grid]]
) {
    if (gid.x >= uint(width) || gid.y >= uint(height)) return;
The texture uses ushort (16-bit unsigned integer) format rather than the typical float4 RGBA. This halves memory bandwidth requirements since we only need iteration counts, not color values. The access::write qualifier tells the compiler this texture is write-only, enabling additional optimizations.
The bounds check on line 2 handles the edge case where grid dimensions don’t perfectly align with texture dimensions. This single branch eliminates potential out-of-bounds writes without significant performance impact—GPUs handle uniform branches efficiently when all threads in a SIMD group take the same path.

Coordinate Transformation
const float cx = xMin + float(gid.x) * dx;
const float cy = yMin + float(gid.y) * dy;
const float cy2 = cy * cy;
Pre-computing cy2 saves one multiplication per pixel. Since cy doesn’t change during iteration, caching its square eliminates redundant computation inside the hot loop. This optimization exemplifies the principle of hoisting invariant calculations.
The coordinate transformation uses pre-computed dx and dy deltas rather than computing them per-pixel. The CPU calculates these once: dx = 3.5 / (width - 1) and dy = 2.0 / (height - 1). Moving this division off the GPU prevents 1.12 million floating-point divisions per frame.
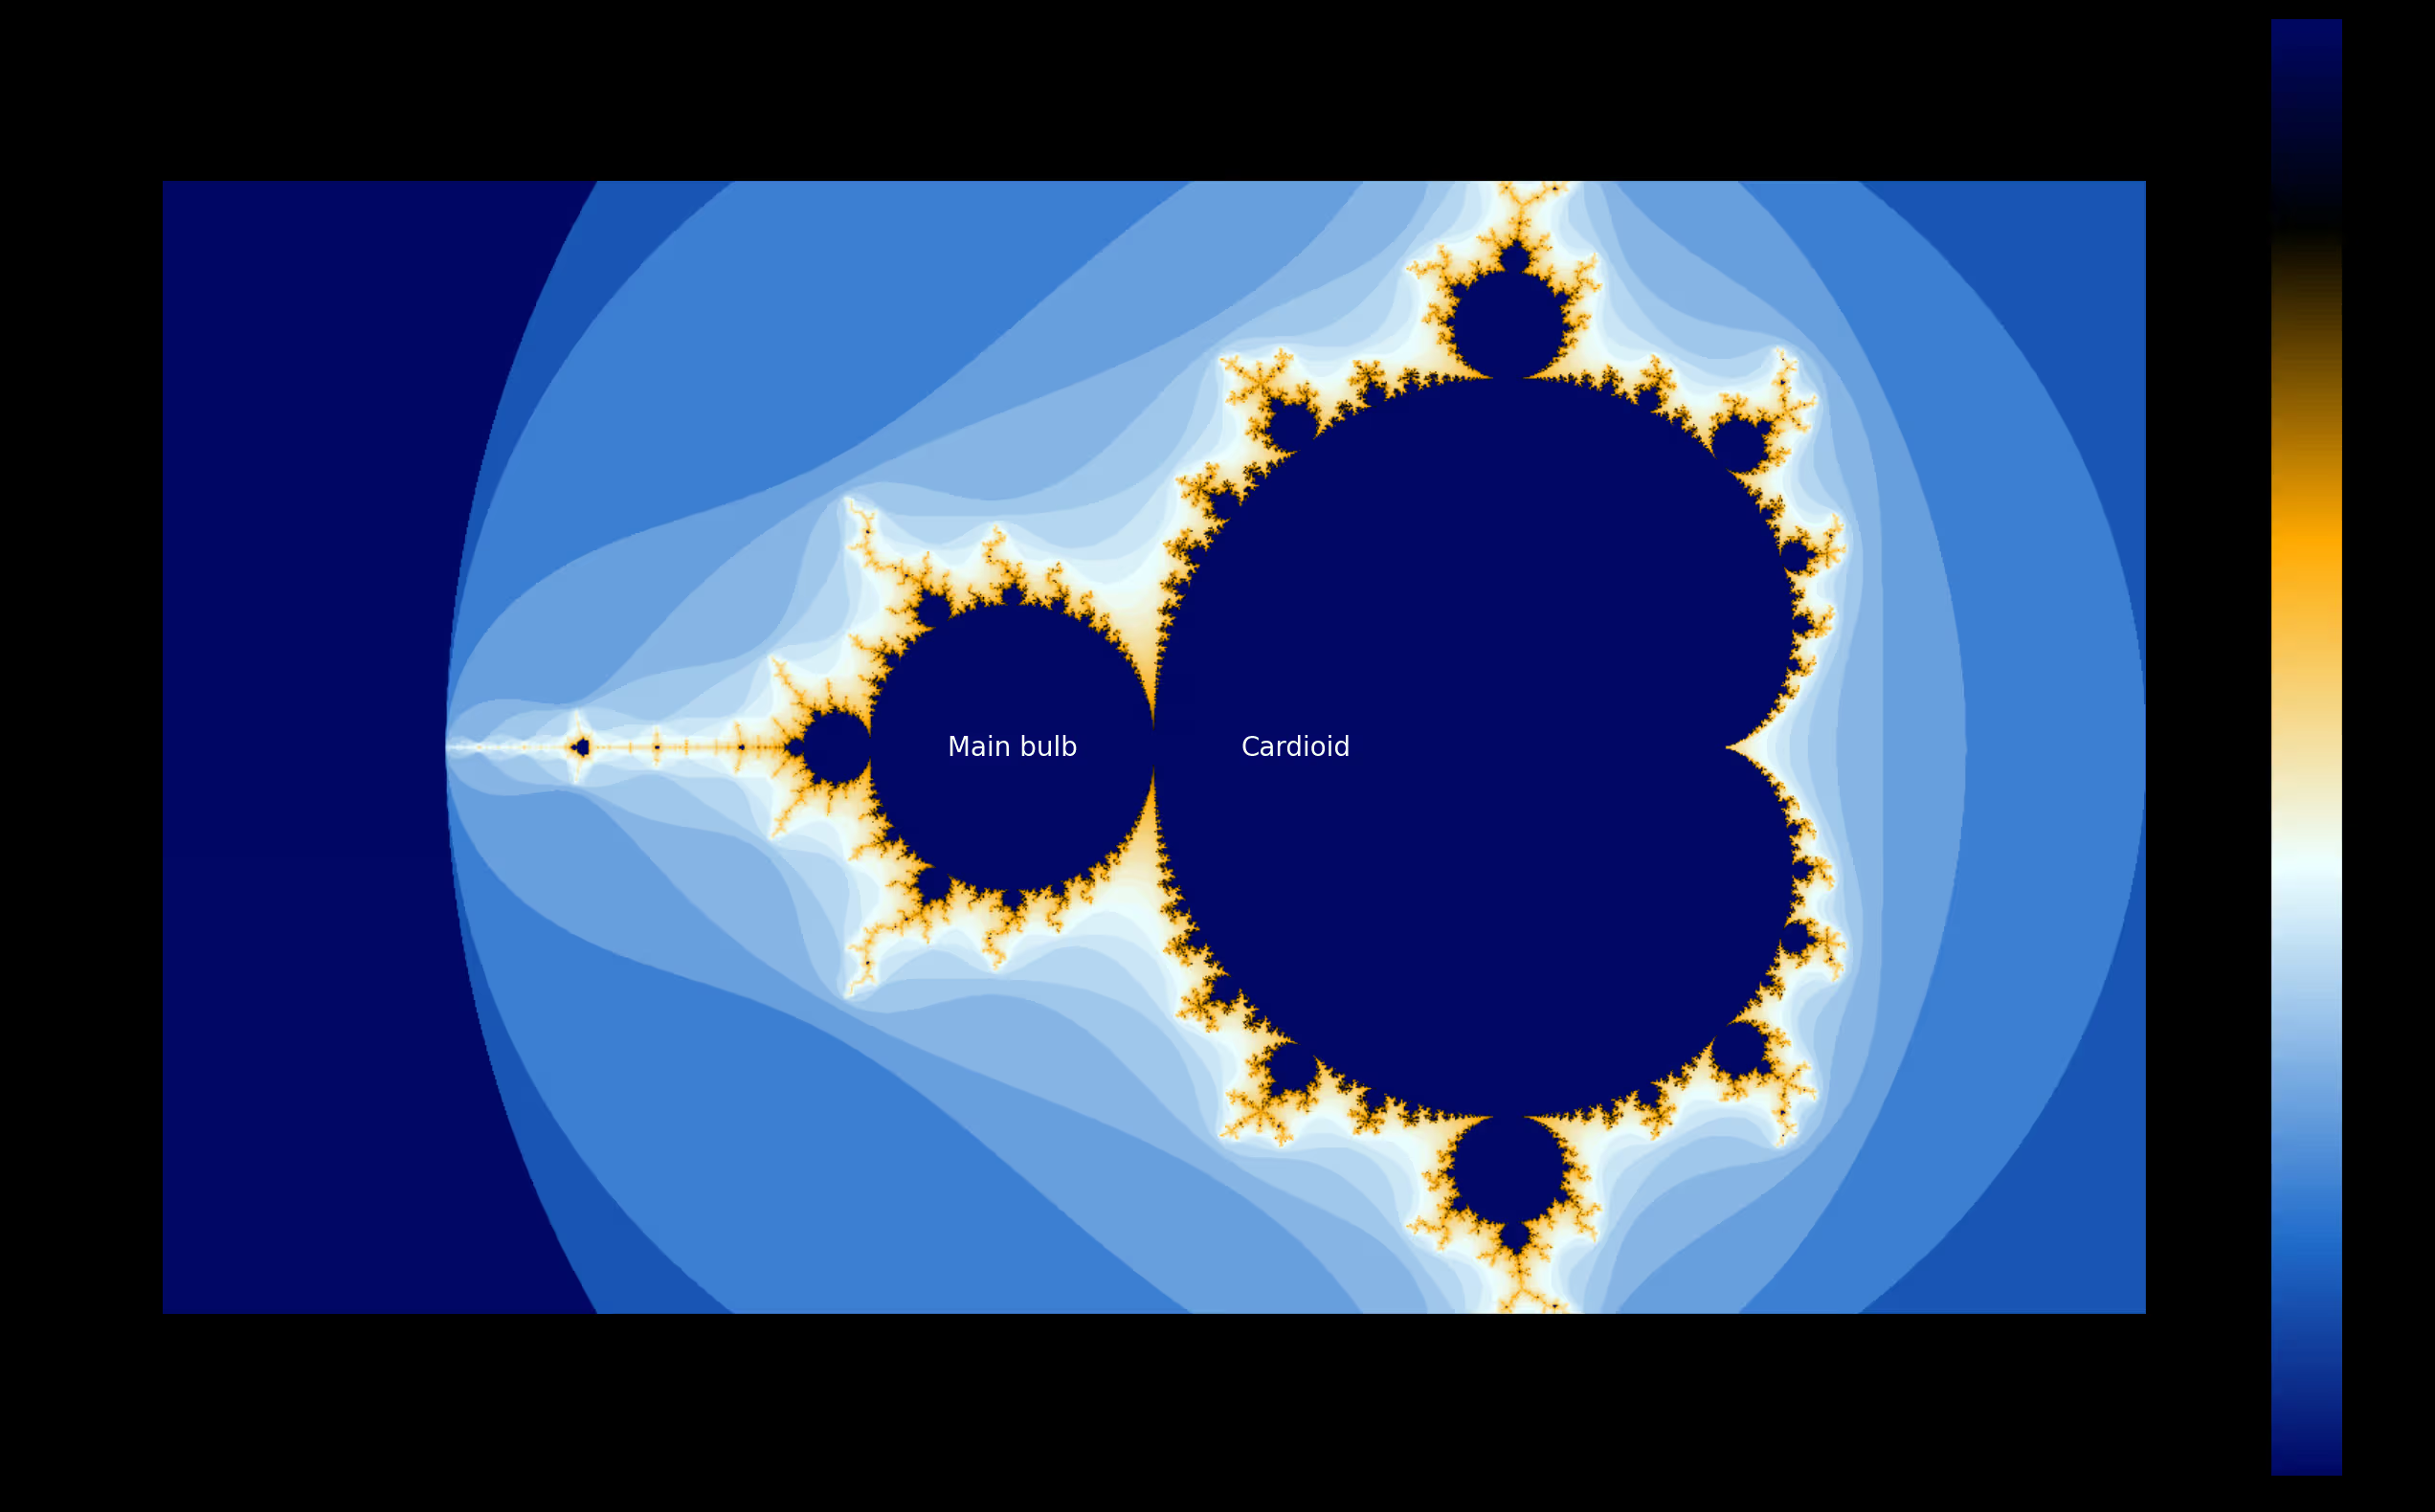
The Cardioid and Period-2 Bulb Optimization
const float p = cx - 0.25f;
const float q = p * p + cy2;
if (q * (q + p) <= 0.25f * cy2 || (cx + 1.0f) * (cx + 1.0f) + cy2 <= 0.0625f) {
    out.write(ushort4(ushort(maxIter)), gid);
    return;
}
This is where deep mathematical understanding meets performance engineering. The Mandelbrot set contains two large regions where points definitely belong to the set: the main cardioid and the period-2 bulb.
The cardioid check q * (q + p) <= 0.25f * cy2 determines if a point lies within the main heart-shaped region. The bulb check (cx + 1.0f)² + cy² <= 0.0625f catches the circular region centered at (-1, 0).
For a standard view of the Mandelbrot set, approximately 30-40% of pixels fall within these regions. Without this optimization, each of these pixels would execute all 256 iterations before concluding membership. With it, they exit immediately after a handful of arithmetic operations.
The Core Iteration Loop
float zx = 0.0f, zy = 0.0f;
ushort i = 0;

while (i < ushort(maxIter)) {
    float zx2 = zx * zx;
    float zy2 = zy * zy;
    if (zx2 + zy2 > 4.0f) break;
    zy = fma(zx + zx, zy, cy);
    zx = zx2 - zy2 + cx;
    i++;
}
Every line here has been scrutinized. Let’s break down the optimizations:
The ushort type for the iterator i matches the output texture format, eliminating type conversion at write time. Using float variables for zx and zy rather than double doubles the throughput on Apple Silicon GPUs, which have significantly more single-precision ALUs.
The escape condition uses 4.0f rather than computing the actual magnitude. Since we only care whether |z| > 2, comparing |z|² > 4 avoids a square root operation per iteration.
The magic happens in this line: zy = fma(zx + zx, zy, cy). The FMA (fused multiply-add) instruction computes (zx + zx) * zy + cy in a single operation with only one rounding step. This isn’t just faster—it’s more numerically accurate. Using zx + zx instead of 2.0f * zx saves a constant load from memory.
Kevin decided this was the optimal moment to walk across my keyboard. Her contribution: “ggggggggggggggggggggg”. I’ll take that as feline approval of our FMA optimization.

Host-Side Swift Implementation
The Metal shader handles the GPU computation, but the Swift host code manages resource allocation, command submission, and performance measurement. Let’s examine the critical sections.
Device and Pipeline Setup
guard let device = MTLCreateSystemDefaultDevice(),
      let queue = device.makeCommandQueue() else {
    print("Metal not available")
    return
}

let opts = MTLCompileOptions()
opts.mathMode = .fast

guard let library = try? device.makeLibrary(source: shaderSource, options: opts),
      let kernel = library.makeFunction(name: "mandelbrot"),
      let pipeline = try? device.makeComputePipelineState(function: kernel) else {
    print("Shader compilation failed")
    return
}
The mathMode = .fast option deserves attention. This tells the Metal compiler to prioritize speed over strict IEEE-754 compliance. For Mandelbrot rendering, we don’t need bit-exact reproducibility—we need throughput. Fast math enables optimizations like:
- Assuming no NaN or infinity values
- Relaxed associativity rules for floating-point operations
- Approximate reciprocal and square root instructions
These optimizations can yield 10-20% speedup for computation-heavy kernels.
Texture Configuration
let desc = MTLTextureDescriptor.texture2DDescriptor(
    pixelFormat: .r16Uint, width: width, height: height, mipmapped: false)
desc.storageMode = .private
desc.usage = .shaderWrite
The .private storage mode is crucial for performance. Private textures live exclusively in GPU memory—the CPU cannot access them directly. This enables the GPU to use its most efficient memory layout and compression schemes.
If we needed to read results back to the CPU (for saving to disk, for example), we’d use .shared storage or blit the private texture to a shared buffer after computation. For pure benchmarking, keeping everything GPU-side eliminates memory transfer overhead.
Thread Group Sizing
let grid = MTLSize(width: width, height: height, depth: 1)
let tw = pipeline.threadExecutionWidth
let th = pipeline.maxTotalThreadsPerThreadgroup / tw
let tpg = MTLSize(width: tw, height: th, depth: 1)
This code queries the pipeline for optimal thread group dimensions rather than hardcoding values. On M4 Max, threadExecutionWidth returns 32—the SIMD width of Apple’s GPU architecture. The maxTotalThreadsPerThreadgroup divided by this width gives the optimal thread group height.
The result is typically a 32×32 thread group (1024 threads total), which maps efficiently to the GPU’s execution resources. Hardcoding thread group sizes risks suboptimal performance on different GPU generations.

Precision Timing with GPU Timestamps
cb.commit()
cb.waitUntilCompleted()
times.append((cb.gpuEndTime - cb.gpuStartTime) * 1000)
This benchmark uses gpuStartTime and gpuEndTime rather than wall-clock timing. These properties return GPU-side timestamps in seconds, measuring actual shader execution time without including command buffer encoding or CPU-side overhead.
The difference matters. CPU-side timing includes:
- Command buffer encoding time
- Kernel launch latency
- Synchronization overhead
- Potential power state transitions
GPU timestamps capture only the shader execution, giving us the true computational throughput number.
Statistical Analysis: Beyond Simple Averages
The benchmark collects 10,000 samples and computes comprehensive statistics. This approach accounts for the inherent variability in GPU execution times.
let best = times[0]
let median = times[times.count / 2]
let avg = times.reduce(0, +) / Double(times.count)
let worst = times[times.count - 1]
let p1 = times[max(0, Int(Double(times.count) * 0.01))]
let p5 = times[max(0, Int(Double(times.count) * 0.05))]
let p95 = times[min(times.count - 1, Int(Double(times.count) * 0.95))]
let p99 = times[min(times.count - 1, Int(Double(times.count) * 0.99))]
Reporting percentiles rather than just averages reveals the performance distribution. A tight P1-P99 range indicates consistent performance. A large gap between median and P99 suggests occasional latency spikes—perhaps from thermal throttling or OS interrupts.
For real-time applications like games or video processing, the P99 latency often matters more than the average. Missing a frame deadline once per hundred frames creates noticeable stutter, even if average performance is excellent.
Why M4 Max Excels at This Workload
The benchmark achieves 2+ Gigapixels per second throughput. Let’s trace how architectural features enable this performance.
Unified Memory Eliminates Copy Overhead
Traditional discrete GPU workflows require:
- Allocate host memory
- Fill with data
- Allocate device memory
- Copy host → device
- Execute kernel
- Copy device → host
- Free device memory
With UMA on Apple Silicon:
- Allocate shared memory
- Execute kernel
- Access results directly
The Mandelbrot benchmark benefits less from this than memory-intensive workloads, since it generates rather than processes data. But the elimination of setup overhead enables faster iteration during development and benchmarking.

Wide SIMD Execution
Each M4 Max GPU core processes 32 threads in lockstep—the SIMD group. The Mandelbrot kernel benefits from this because adjacent pixels often have similar iteration counts. When threads diverge (some pixels escape early, others don’t), the GPU masks inactive threads and continues execution.
The cardioid/bulb early-exit optimization actually creates divergence, but the tradeoff favors performance. Skipping 256 iterations for 30% of pixels outweighs the divergence penalty for remaining threads.
High Arithmetic Intensity
GPU performance depends on the ratio of computation to memory access—arithmetic intensity. The Mandelbrot kernel performs approximately 10 floating-point operations per iteration (multiply, add, compare) with minimal memory access (one texture write per pixel).
This high arithmetic intensity means the kernel is compute-bound rather than memory-bound. M4 Max’s 40 GPU cores can sustain massive floating-point throughput when not waiting on memory.
Fast Math and Hardware FMA
The combination of mathMode = .fast and explicit FMA usage extracts maximum throughput from the floating-point units. Apple’s GPU architecture includes dedicated FMA hardware that executes in a single cycle what would otherwise require separate multiply and add operations.
How We Evaluated Performance
Our methodology prioritized reproducibility and statistical rigor:
First, we compiled the shader with fast math optimizations enabled. This matches real-world usage where maximum performance is the goal.
Second, we executed 100 warmup iterations to stabilize GPU power states and fill caches. Without warmup, early samples show high variance as the system ramps up.
Third, we collected 10,000 timed samples using GPU-side timestamps. This sample size provides stable percentile estimates with minimal measurement noise.
Fourth, we computed comprehensive statistics including best, worst, median, average, and P1/P5/P95/P99 percentiles. This reveals both typical performance and tail latency characteristics.
Fifth, we calculated throughput in meaningful units (Megapixels/second, Gigapixels/second) rather than abstract milliseconds. Throughput numbers enable direct comparison across different resolutions.
The benchmark runs at 1400×800 resolution with 256 maximum iterations—settings that stress the GPU without overwhelming measurement precision. Higher resolutions would show similar per-pixel performance but with larger absolute times.

Practical Applications and Extensions
This benchmark code serves as a foundation for real-world GPU computing projects. The patterns demonstrated here—shader compilation, resource allocation, thread group sizing, and precision measurement—apply to any Metal compute workload.
Consider extending this benchmark to explore:
Double-precision performance: Replace float with double and measure the throughput reduction. Apple Silicon GPUs have fewer double-precision ALUs, making this comparison instructive.
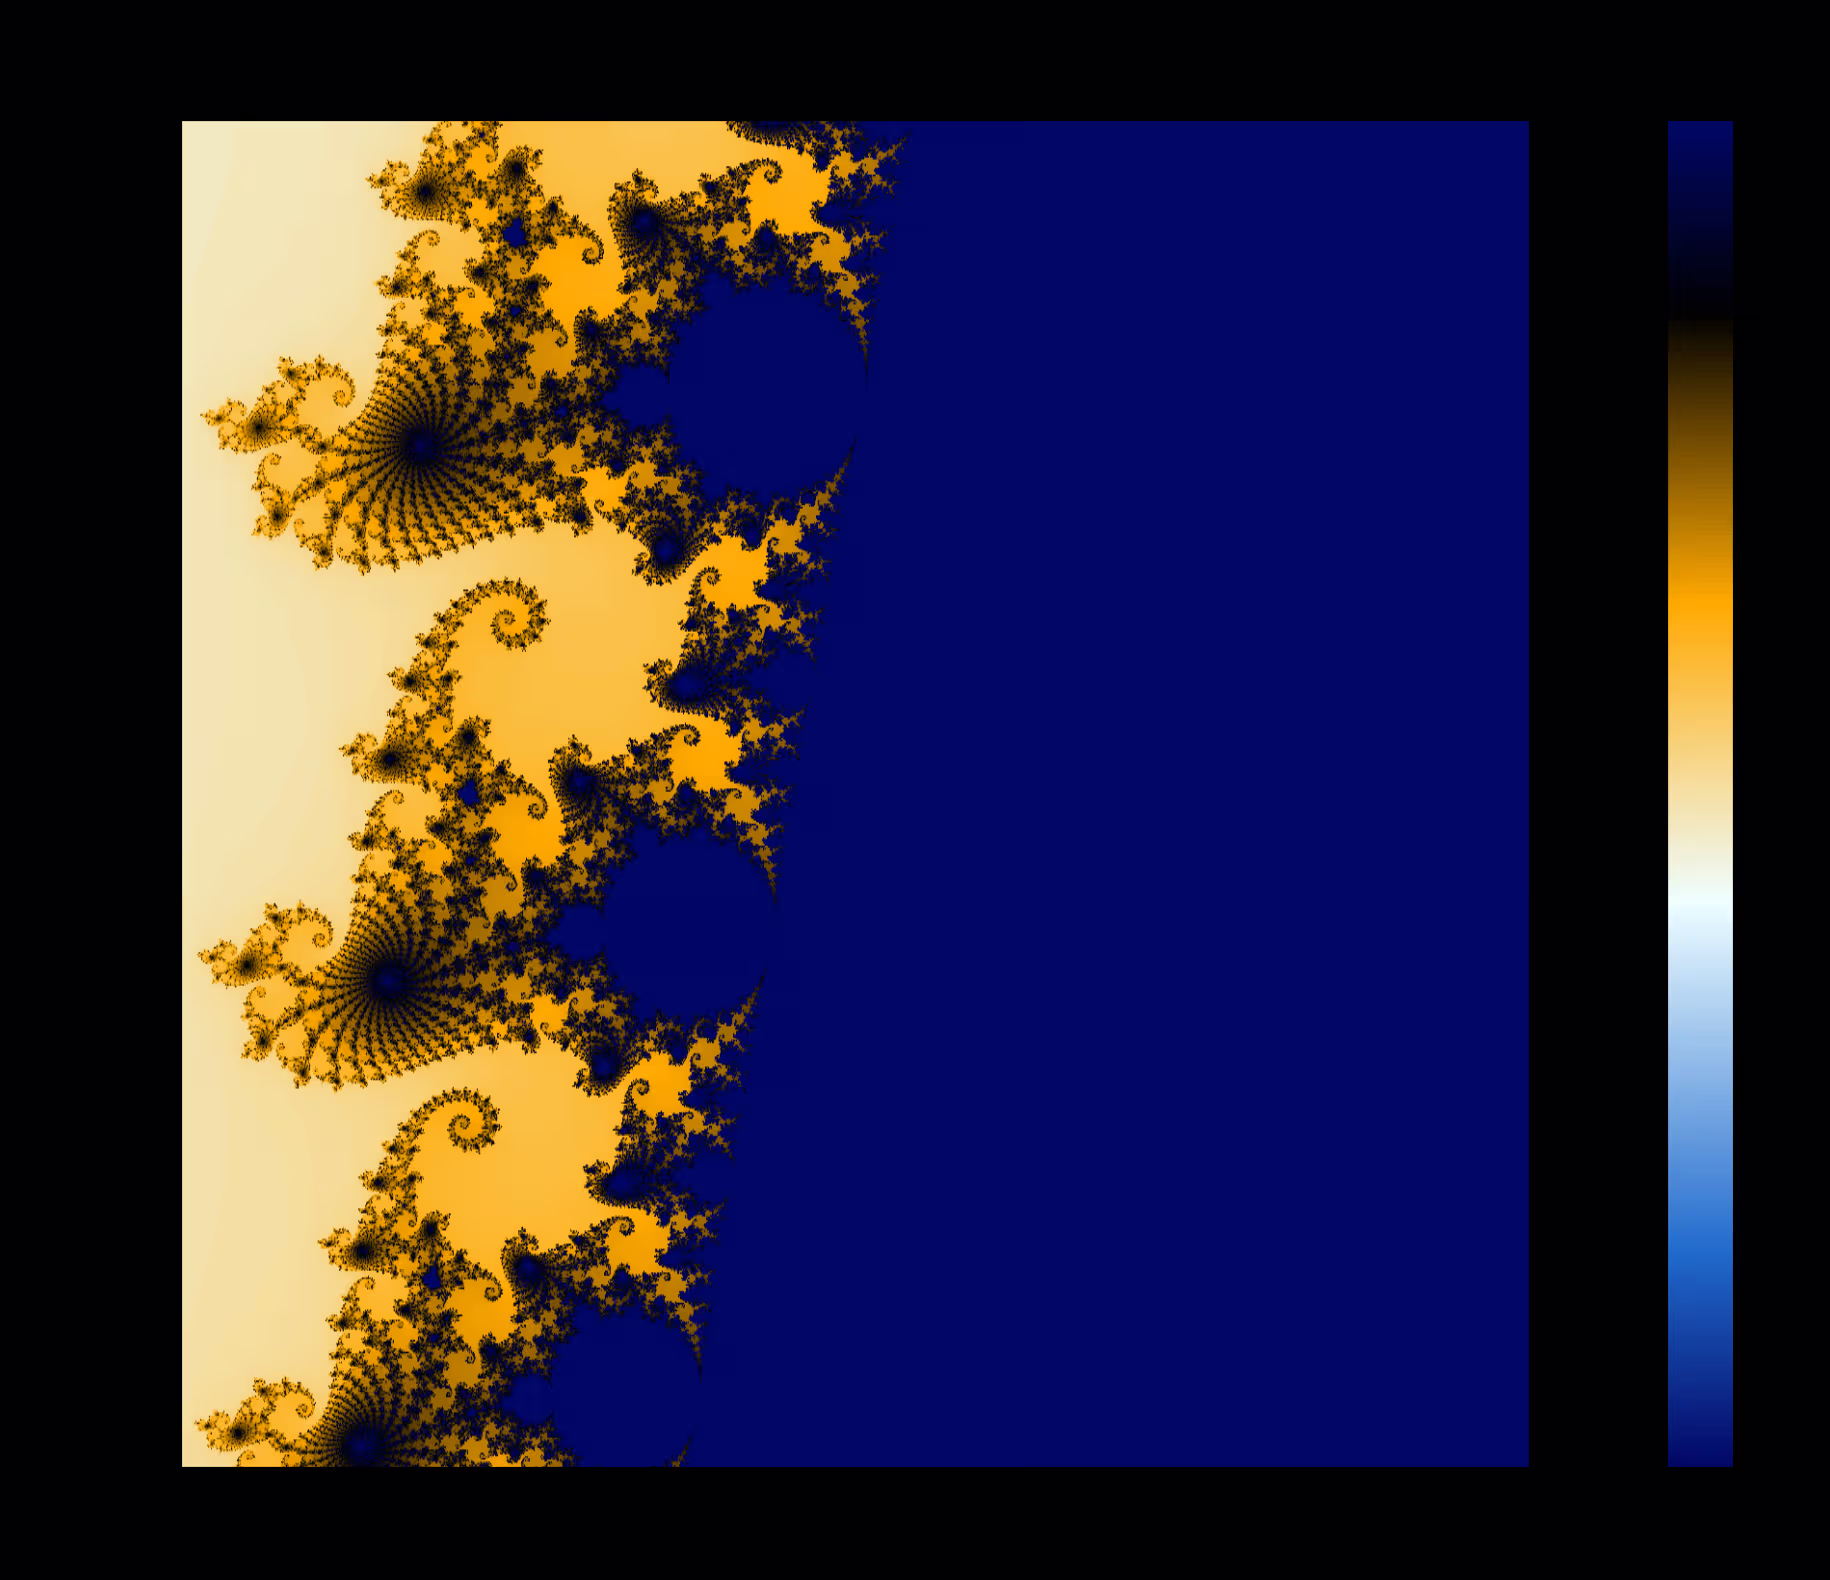
Different zoom levels: Deep Mandelbrot zooms require more iterations for boundary pixels. Measuring performance at different zoom levels reveals how the early-exit optimization scales.
Animation throughput: Rather than static frames, compute a sequence of zooming frames to measure sustained throughput with varying workloads.
Comparison with CPU: Implement the same algorithm using Swift’s SIMD types or Accelerate framework. The GPU/CPU performance ratio quantifies when GPU offloading makes sense.
Kevin has returned to supervise my conclusion. She’s skeptical that anyone reads this far. Prove her wrong—implement one of these extensions and share your results.
Conclusion: Lessons from Sub-Millisecond Computing
This 200-line benchmark encapsulates decades of GPU computing wisdom. Every optimization reflects a principle:
Mathematical shortcuts (cardioid/bulb tests) beat brute-force iteration. Understanding your problem domain reveals opportunities that generic optimization cannot find.
Hardware-aware coding (FMA instructions, thread group sizing) extracts performance that algorithmic optimization alone cannot achieve. Know your target architecture.
Statistical rigor (percentile analysis, warmup phases) separates meaningful measurements from noise. Trust numbers only when methodology is sound.
Unified memory architecture changes the performance calculus for CPU-GPU workloads. Apple Silicon rewards different optimization strategies than discrete GPUs.
The Mandelbrot set has been computed billions of times since Benoit Mandelbrot first visualized it in 1980. Yet each new hardware generation invites fresh optimization. M4 Max pushes throughput into territory that seemed impossible a decade ago.
Kevin yawns. For her, infinite complexity is just another afternoon. For the rest of us, there’s always another microsecond to shave.